
Grow on YouTube
YouTube Analytics: how to read the data (and what to do with it)
Most people open Analytics and look at the view count like they're checking a scoreboard. But Analytics isn't a scoreboard — it's a to-do list your audience wrote for you, second by second. Learning to read the retention curve is the difference between “posting a video” and building a video that holds.
~11 min read

1. The Studio map: where everything lives
Before you interpret anything, know where to look. YouTube Analytics is split into tabs, and each one answers a different question:
- Reach — how people FIND you: impressions, CTR (click-through rate) and traffic sources.
- Engagement — what they do AFTER clicking: watch time, average duration and the retention curve.
- Audience — WHO they are: new vs. returning, geography, subscribers gained.
- Research — what your audience is SEARCHING for — real demand, with content gaps to fill.
2. The metrics that drive decisions (and the vanity ones)
- Retention (the mother metric) — average duration and average % watched tell you whether the video holds. But they're an AVERAGE — they don't tell you WHERE the person left. For that, the curve (section 3).
- CTR vs. impressions (always together) — CTR alone misleads. A high CTR on few impressions is your loyal audience; as it scales, it falls — and that's good (section 4).
- Traffic sources — Home/Browse = the algorithm picked you; Suggested = you rode alongside a topic; Search = active intent; External = traffic from outside. Each one is its own read.
- New · casual · regular — YouTube now splits the audience into these three (replacing the old “new vs. returning”). The regular viewer — someone who watches at least once a month for over 6 months — is your real audience, and a viewer who comes back is one of the strongest loyalty signals.
- Geography → RPM — where the audience comes from explains why the same views earn different amounts (cross-reference our monetization guide).
- Vanity — views and subscribers are NOT a lever — they're a result. YouTube itself says subscriber count doesn't measure your active audience well.
How these numbers turn into money is in the guide to monetization and AdSense; the why behind the algorithm rewarding retention is in how the algorithm works.
3. Read the retention curve like an editor
This is where the most valuable read lives — and where the average creator sees a number and the person who learns to read it sees a list of cut decisions. The curve shows, second by second, how many people are still watching. Each of its shapes has an official meaning and a matching editing decision — and that read is exactly what you take to your editor as feedback:
| Curve shape | What it means | Editor's decision |
|---|---|---|
| Drop in the first 30s | how many people got past the opening | cut the intro/ident; deliver the title's promise within the first few seconds |
| Dip | drop-off/skip at that point | find the timestamp and cut or tighten — a tangent, redundancy or dead pause |
| Gradual decline | slow loss of interest | raise the density: cuts, scene changes, graphics, pattern interrupts |
| Flat line | watching start to finish there | replicate what worked (pacing/format) in the next videos |
| Spike | rewatching/sharing that part | it has replay value — pull it to the front, make it a cold open or a Short |
4. The #1 mistake: reading CTR without impressions
This one trips up almost everyone. YouTube gives the official example: a video with 10,000 impressions had a 9% CTR; by the time it reached 100,000 impressions, it dropped to 3.5%. It looks like a decline — but it's success: that high early CTR came from your most loyal audience (inflated), and the drop means the video expanded to a broad audience.
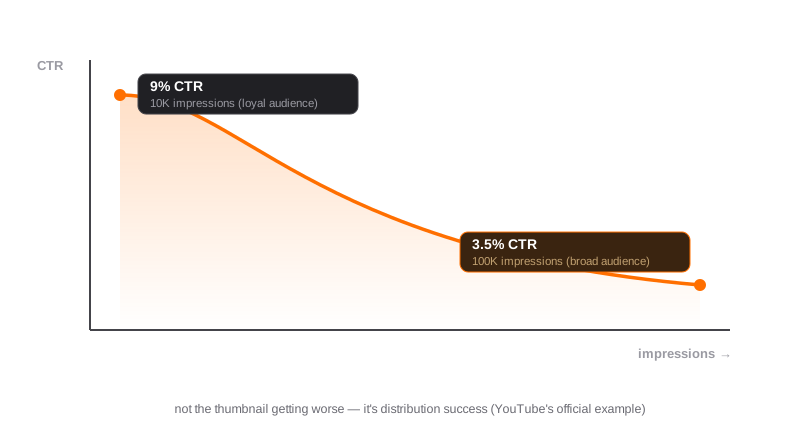
- Golden rule — never judge CTR without looking at the impression volume next to it. CTR falling + impressions rising = distribution working.
- CTR varies by surface — Home generates a lot of impressions with a lower CTR; Search generates fewer impressions with a higher CTR (intent). Comparing CTR across sources without this misleads.
- The packaging — improving the thumbnail and title raises CTR — but it only sticks if retention delivers; a high CTR with low retention won't turn into distribution.
- To calibrate — YouTube says half of channels and videos sit between 2% and 10% CTR. Above that is great; well below, the packaging probably needs work.
The packaging details are in the guide to thumbnail and title.
5. The Research tab: find demand before you record
The Research tab shows what your audience (and YouTube) is searching for, with a volume level — and flags content gaps (topics with heavy search but little quality coverage). It's the way to create for real demand, not for a guess. Combine it with YouTube's search autocomplete to validate the topic before you spend a day recording.
6. The trick of the trade: the numbers are yours — the craft is turning feedback into cuts
There's one detail that changes everything in practice: the Analytics is yours. Your channel's curve lives in your own YouTube Studio — no one on the outside sees your channel's data. That's why learning to read the curve isn't a luxury: it's what gives you the vocabulary to direct the edit. When you open Studio and see the dip at 1:45, you don't have to guess — you say “retention nosedives in the middle, there's a draggy stretch there,” and a good editor knows instantly that it's a tangent to cut. You bring the read; the editor turns it into a cut decision, video after video.
That's where an editor who sticks with you is worth their weight in gold: over time they learn your audience and your pacing, and your feedback gets shorter — you say “it dropped in the middle again” and they already know what to do. You create and read the numbers; we turn that feedback into a video that holds.
Quick questions
What's the most important metric in YouTube Analytics?
It's not views or subscribers — it's retention (average duration and the audience curve). It tells you whether the video holds the person, which is the signal the algorithm values most. YouTube itself warns that subscriber count isn't the most accurate way to measure your active audience.
My CTR dropped from 9% to 3.5%. Is something wrong?
It's probably the opposite — success. YouTube gives this exact example: a high CTR on few impressions comes from your most loyal audience (inflated); when the video scales to a broad audience, the CTR naturally falls. CTR falling WHILE impressions rise is a sign the video is expanding, not that the thumbnail is bad. Never look at CTR without the impression volume next to it.
What is the retention curve and how do I read it?
It's a graph that shows, second by second, what percentage of the audience is still watching. A drop in the first 30s = your intro is costing you. A flat line = a stretch that grips. A dip = drop-off at that point (cut or tighten there). A spike = a replay moment (worth highlighting). Use RELATIVE retention to compare against videos of similar length and tell whether a dip is your problem or normal.
How much retention is “good”?
It varies by niche and length — which is why YouTube created relative retention (it compares against videos of similar length). As a market benchmark: 5–15 min videos with ~40–55% average retention are doing well; market estimates point to a much lower real average (~24%). Don't chase a single number: one video is noise, the pattern across several videos is the signal.
What does each traffic source tell me?
Browse (Home) = the algorithm is choosing to recommend you (strong distribution). Suggested = you're “riding alongside” videos on a similar topic. Search = people with active intent looking for the subject. External = traffic from outside YouTube. Each one calls for a different read — and the Research tab shows what your audience is searching for.
Why does audience geography matter?
Because how much you earn per thousand views (RPM) varies a lot by country: a US/UK audience monetizes several times more than one in developing markets. The Audience tab shows where your viewers come from — that's what explains why two videos with the same views earn different amounts.
Should I worry about my subscriber count?
Less than you think. YouTube literally says that subscriber count isn't the most accurate way to estimate your active audience — plenty of subscribers don't watch. Watch time, retention and returning viewers count more. A subscriber is a result, not a lever.
Sources
- Measure key retention moments (YouTube Help) — the official curve shapes: intro, flat, dip, spike.
- Decode CTR and impressions (YouTube Help) — why CTR falls as the video scales (the 9%→3.5% example).
- Understand your video's reach (YouTube Help) — impressions and the traffic sources, defined.
- New and returning viewers (YouTube Help) — new/casual/regular + the anti-vanity note on subscribers.
Reading Analytics takes you out of the dark: every curve is your audience telling you where to improve. While you read the data and tune the packaging and the workings of the algorithm, the part of turning the feedback you pull from it into a video that holds is on HEY JOE. And when a video performs, the next step is repurposing that recording into multiple pieces of content.